
Performance
/performance measures one thing: your invested portfolio, meaning the lines held in
a PEA, a life-insurance contract or a securities account. Crypto is a category of its own
and counts in none of these figures. Neither does a passbook, a property or a loan.
That is the difference from Evolution and from the dashboard, which read your whole net worth. Here, money moving in and out is neutralised, so what is left is the market’s doing.
The six metrics
Section titled “The six metrics”| Metric | What it answers |
|---|---|
| Invested | What you put in, buys less sells, gains excluded. |
| Invested value | What those lines are worth today. |
| Unrealized gain | The second less the first, as long as you have not sold. |
| IRR | Money-weighted return: what your money earned, each contribution counted from the month it was paid in. |
| TWR | Time-weighted return: the portfolio’s own performance, neutral to contributions. The one to compare against an index. |
| Volatility and Sharpe | How much it moves, and whether the return paid for that movement. |
Against an index, and against its own peak
Section titled “Against an index, and against its own peak”Performance vs index rebases your portfolio and a reference index to 100 at your first invested month. The index is yours to pick and is kept with your preferences. The note under it matters: the comparison runs against the price of a tracker quoted in euros, which carries that fund’s ongoing charges, where the bare index does not.
Decline from the peak gives two numbers: Today, the current gap to your high water mark, and Worst dip, the deepest fall so far. Both are measured on performance, so a withdrawal never shows up as a drop.
Two readings of the calendar
Section titled “Two readings of the calendar”The Monthly performance grid is the one card on this page that can leave the invested portfolio, and it opens on the wider of the two:
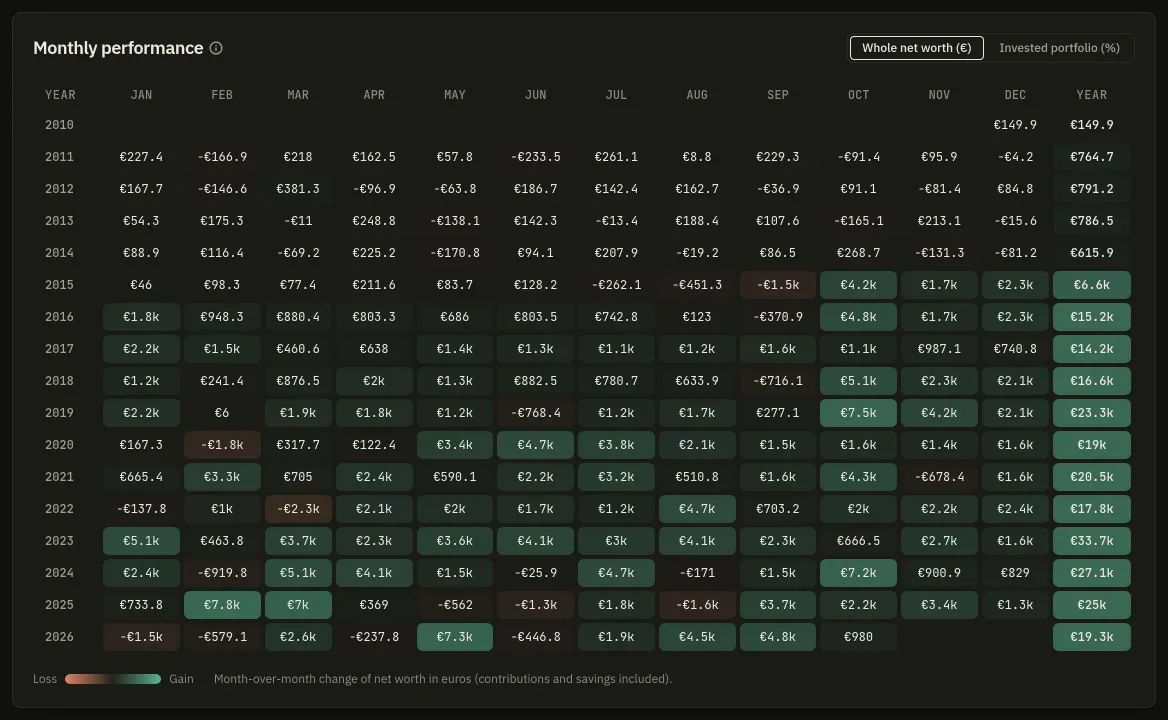
- Whole net worth (€): the month-over-month change of everything you hold, savings and contributions included. This is “did my wealth grow in March”.
- Invested portfolio (%): the chained return of the invested lines, contributions excluded. This is “did my investments do well in March”.
A month where you paid in €2,000 and the market fell will be green in euros and red in percent. Both are correct; they answer different questions. The grid starts at your first invested month either way.
The Annual summary at the foot takes the euro view one step further and splits each year into Market gain and Savings / added, which add up to the net worth change. Only the first column measures your investments. Fees are not here: they are on Fees.